IllustrativeDNA proxy bias: why my three-quarter Ashkenazi kit challenges the half-Canaanite narrative
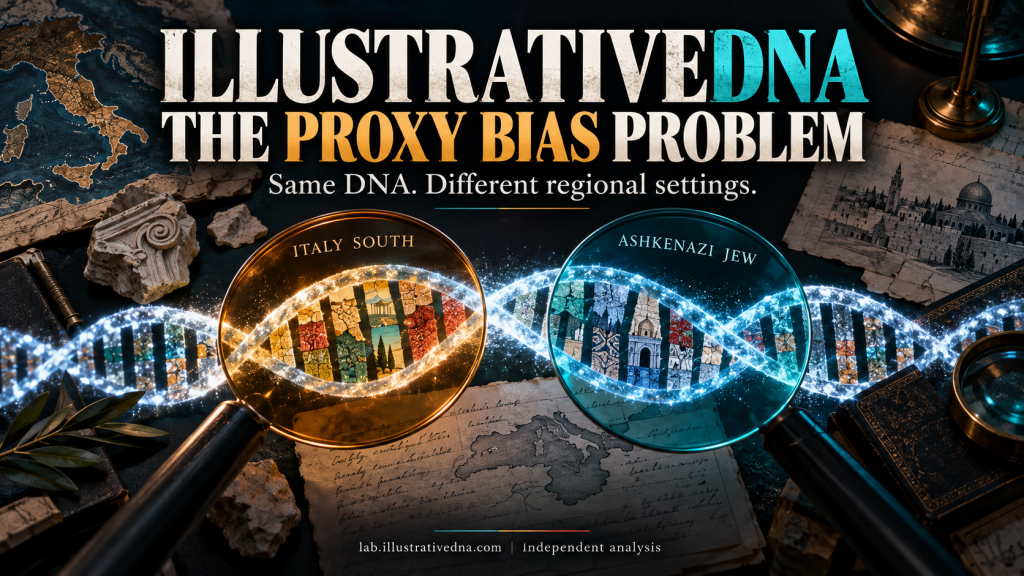
IllustrativeDNA proxy bias becomes visible when the same DNA receives different ancestry assignments under different regional settings. My results at lab.illustrativedna.com demonstrate that problem directly. They also challenge a recurring interpretation in online Jewish genetics discussions: that Ashkenazi ancestry should predictably produce something approaching a half-Canaanite result.
My family background is 75% Eastern European Ashkenazi, 12.5% Southern Italian and 12.5% English. Yet even under IllustrativeDNA’s Ashkenazi Jew regional setting, my Bronze Age model assigns only 24.4% Canaanite. My separate Hunter-Gatherer & Farmer result assigns 2.4% Natufian.
Those observations cannot be explained away merely by pointing to my non-Ashkenazi quarter. Under the simple proportional arithmetic commonly implied by that dismissal, scaling 24.4% to a full Ashkenazi contribution gives approximately 32.5%, not 50%. The assumptions behind the explanation need to be tested rather than asserted.
1. IllustrativeDNA proxy bias can be tested on one unchanged kit
I recorded 67 IllustrativeDNA outputs across 17 regional ancestry settings and four periods: Bronze Age, Iron Age, Late Antiquity and Middle Ages. Repeated results leave 52 distinct period, fit and component combinations. Balkan West’s Late Antiquity result was not supplied.
The DNA input stayed unchanged. The selected regional configuration changed. This is a test of reference dependence, not an attempt to describe my recent family background as entirely Ashkenazi.
A reference population is a genetic comparison used by the model. When available references or constraints change, shared genetic variation can be allocated differently. This makes IllustrativeDNA a clear example of the proxy-choice problem: the historical story depends partly on the configuration used to construct it.
unchanged DNA sample
regional settings
recorded results
distinct outputs
2. My 24.4% Canaanite result does not simply become 50%
This finding comes from IllustrativeDNA’s own Ashkenazi Jew setting, with a Good Bronze Age fit of 2.485. It cannot be dismissed as the consequence of selecting an Italian regional model.
Suppose, for the sake of testing the dilution explanation, that the fitted component combines proportionally with recent ancestry. Let A represent the component within my Ashkenazi contribution and B within my remaining quarter. The proposed relationship would be:
Assigning zero Canaanite to the entire non-Ashkenazi quarter gives the largest possible A within that simplified calculation: 32.53%. Any positive contribution from that quarter would lower the inferred A further.
Conversely, if the Ashkenazi contribution were uniformly 50% Canaanite under this same model, three-quarters of that contribution would already supply 37.5%. My reported result is 24.4%, a difference of 13.1 percentage points.
Testing the “missing Ashkenazi grandparent” explanation
Shared scale: 0–50%. Blue is the observed output; teal and orange are conditional calculations.
My IllustrativeDNA Canaanite assignment: 24.4%
Proportional full-Ashkenazi equivalent: 32.53%
Expected from 75% of a hypothetical 50% source: 37.5%
The proposed full-population benchmark: 50%
Adding another Ashkenazi grandparent with the same assumed component profile would therefore not automatically turn this result into 50%. The claim needs a different ancestral profile or different model behaviour, not merely the statement that I am one-quarter non-Ashkenazi.
Ancient-reference coefficients are not guaranteed to behave linearly, and genealogical fractions are not exact inherited genomic fractions. That limits the calculation as a prediction, but it also defeats the simplistic dilution argument. One cannot invoke proportional dilution to dismiss my result and then ignore its arithmetic.
This calculation concerns the 24.4% Bronze Age Canaanite assignment. My separate Ashkenazi-setting Roman Levant result is 36%; mechanically scaling that would give 48%. Those are different historical models. Their disagreement reinforces the need to identify precisely which percentage is being discussed.
3. Regional ancestry settings reshape Canaanite and Phoenician assignments
IllustrativeDNA proxy bias is visible across the Bronze Age results. France North selects no separate Canaanite component at a Good fit of 2.276. Italy South assigns 18.8% at 2.219. Ashkenazi Jew assigns 24.4% at 2.485. Egypt assigns 47% at a poorer, Moderate fit of 3.839.
“Not selected” describes the fitted output, not proof that all related ancestry is absent. The important result is the redistribution under different regional ancestry settings.
| IllustrativeDNA Bronze Age setting | Canaanite | Fit |
|---|---|---|
| France North | Not selected | 2.276, Good |
| Central Europe | Not selected | 2.630, Good |
| North Africa | 5.6% | 2.289, Good |
| Greece & Cyprus | 17.0% | 2.251, Good |
| France South | 17.6% | 2.139, Good |
| Italy South | 18.8% | 2.219, Good |
| Ashkenazi Jew | 24.4% | 2.485, Good |
| Levant | 27.6% | 3.669, Moderate |
| Egypt | 47.0% | 3.839, Moderate |
The Iron Age comparison is even sharper. Greece & Cyprus assigns 9% Phoenician at 2.040. Balkan West assigns 36% at 2.070. Both are Good. The component quadruples while the fit changes by only 0.030.
IllustrativeDNA Iron Age: Phoenician assignment
Shared scale: 0–70%.
Greece & Cyprus: 9.0% · Fit 2.040, Good
Balkan West: 36.0% · Fit 2.070, Good
Ashkenazi Jew: 31.6% · Fit 2.124, Good
Balkan East: 31.2% · Fit 2.147, Good
Italy North: 41.0% · Fit 2.047, Good
Sardinia: 41.6% · Fit 2.141, Good
Levant: 63.8% · Fit 6.648, Bad
4. IllustrativeDNA trades Roman Italy for Roman Levant
In Late Antiquity, Italy South produces 75% Roman Italy, 21.2% Germanic and 3.8% Roman North Africa. Ashkenazi Jew produces 31.2% Roman Italy, 32.8% Germanic and 36% Roman Levant.
IllustrativeDNA proxy bias: two Roman-period reconstructions
Each bar totals 100%. Identical DNA input.
Italy South · Fit 1.721, Good
Roman Italy 75.0% · Germanic 21.2% · Roman North Africa 3.8%
Ashkenazi Jew · Fit 1.698, Good
Roman Italy 31.2% · Germanic 32.8% · Roman Levant 36.0%
Colours: Teal = Roman Italy; grey = Germanic; gold = Roman North Africa; purple = Roman Levant.
These near-equal fit scores do not uniquely identify either reconstruction as history. They demonstrate why regional ancestry settings must accompany the percentages. A screenshot showing only the Ashkenazi configuration hides an important alternative.
5. My 2.4% Natufian result raises the same dilution problem
The separate IllustrativeDNA Hunter-Gatherer & Farmer report assigns 2.4% Natufian. Its complete breakdown is shown below. This report is distinct from the periodical models; I have not demonstrated that its output changes with the regional selector.
| IllustrativeDNA component | Assignment |
|---|---|
| Anatolian Neolithic Farmer | 59.2% |
| European Hunter-Gatherer | 18.6% |
| Caucasus Hunter-Gatherer | 13.0% |
| Zagros Neolithic Farmer | 5.8% |
| Natufian Hunter-Gatherer | 2.4% |
| South American Hunter-Gatherer | 0.4% |
| Sub-Saharan African | 0.4% |
| East African Savanna Pastoralist | 0.2% |
Under the same simplified proportional test, 2.4 ÷ 0.75 gives 3.2%. A hypothetical 10% Natufian value in the Ashkenazi contribution would instead supply 7.5 percentage points before adding anything from the remaining quarter. A 20% value would supply 15 points.
Again, the automatic dilution explanation fails on its own assumptions. Understanding the actual output requires attention to inheritance, individual variation and reference fitting.
Natufian and Canaanite are not interchangeable categories. Ancient-DNA research on the Bronze Age southern Levant identifies ancestry related to earlier local populations and Zagros- or Caucasus-related sources. Later Levantine references contain more than a Natufian-related component.
Neither a low Natufian result nor a high one independently measures total Jewish or Levantine ancestry. IllustrativeDNA proxy bias becomes especially misleading when these different reference categories are treated as interchangeable ethnic measurements.
6. Why I suspect selective presentation on r/JewishDNA
I strongly suspect selection bias in the results highlighted on r/JewishDNA: high Canaanite and Natufian assignments receive attention, while lower results and alternative regional ancestry settings receive less consideration. My experience has also left me concerned about gatekeeping and censorship of challenges to that narrative. These are my stated concerns, not findings from a complete moderation audit.
A concrete example is the “100% Ashkenazi American” discussion, where a commenter interprets a reported 48% Canaanite assignment as evidence of a Levantward shift. The missing comparison is what that same kit produces under other plausible regional ancestry settings.
My own Ashkenazi-setting result is 24.4%, not approximately half. Scaling away my non-Ashkenazi quarter does not bridge that difference under the simple proportional explanation. That makes my result relevant evidence, rather than something to discard because it does not resemble a preferred screenshot.
To establish how common high or low values actually are, a comparison would need consistently collected kits, matching calculator versions, stated regional ancestry settings and complete fit information. A selectively visible stream of screenshots supplies none of those controls.
The strongest criticism is therefore methodological: high assignments can be genuine software outputs and still be overinterpreted. Lower assignments cannot be dismissed by a different standard. IllustrativeDNA proxy bias needs testing on the celebrated high-percentage kits too.
7. My preprint and ancient Italian comparisons explain why the proxies matter
My preprint, How Ashkenazi Origins Were Mis-modeled, examines source choice at the population level. Table 7 keeps the Ashkenazi target fixed while changing the Italian proxy in qpAdm.
Preprint: the Lebanese coefficient changes with the Italian proxy
Author-reported qpAdm results. Shared scale: 0–50%.
Southern Italian proxy: 22.06% Lebanese
Italian 69.97% · Russian 7.97% · p = 0.1445 · Reported feasible
Central Italian proxy: 33.83% Lebanese
Italian 61.33% · Russian 4.84% · p = 0.0514 · Reported feasible
Northern Italian proxy: 42.57% Lebanese
Italian 54.53% · Russian 2.90% · p = 0.0256 · Reported infeasible
qpAdm and IllustrativeDNA’s periodical calculator use different approaches, and these are different targets. Nevertheless, both comparisons make source choice consequential. Their coefficients cannot simply be presented as reference-independent historical quantities.
The personal IllustrativeDNA results also repeatedly select substantial Italian-related components outside the Italy South setting: Late Antiquity assigns 75.2% Roman Italy under Italy North, 74.2% under North Africa, 68.4% under France South and 66.6% under Sardinia, all with reported Good fits.
My October 5 article, Ashkenazi Origins: Ancient DNA and Southern Italian Roots, places that affinity in historical context. Imperial R835, early medieval VEN006 and medieval VK535 show closely interleaved Italian and Ashkenazi affinities in the collected comparisons.
These are meaningful Mediterranean connections. IllustrativeDNA proxy bias affects how their shared genetic variation is partitioned into labels; it does not make the recurring affinity disappear.
IllustrativeDNA proxy bias demands the full comparison
My three-quarter Ashkenazi kit receives 24.4% Canaanite even under IllustrativeDNA’s Ashkenazi regional model. The simple “missing grandparent” calculation produces approximately 32.5%, not 50%. My 2.4% Natufian result presents a parallel challenge to automatic dilution explanations.
Across regional ancestry settings, the same kit also receives sharply different historical allocations with similarly good fits. These observations challenge universal half-Canaanite expectations and the selective elevation of high-Natufian screenshots.
The appropriate response is to show the competing models, their fit scores and the lower results alongside the higher ones. The DNA has not changed. The interpretation needs to account for everything the calculator actually returns.
Sources and reporting notes
- IllustrativeDNA laboratory website: source of my recorded periodical and Hunter-Gatherer & Farmer outputs.
- Personal dataset: 67 recorded outputs, 17 regional settings and 52 distinct period/fit/component combinations. Balkan West Late Antiquity was not supplied.
- Arithmetic: 24.4 ÷ 0.75 = 32.5333; 0.75 × 50 = 37.5; 37.5 − 24.4 = 13.1; 2.4 ÷ 0.75 = 3.2. These are conditional proportional calculations, not reconstructed results for relatives.
- Steven Parker, How Ashkenazi Origins Were Mis-modeled, version 2: Table 7, author-reported qpAdm results.
- Ashkenazi Origins: Ancient DNA and Southern Italian Roots: October 5, 2026, companion article.
- Agranat-Tamir et al., The Genomic History of the Bronze Age Southern Levant: context for distinguishing Canaanite-related references from Natufian components.
- “100% Ashkenazi American,” r/JewishDNA: an example of interpreting a reported Canaanite assignment, not a representative survey of subreddit results.